#SWDchallenge: improve this table
It’s October! While I have a fondness for the beginning of fall and the changing leaves out my office window are already a beautiful mix of green, yellow, and orange, something even more exciting happens this month: the publication of my new book! Perfect timing to have a challenge taken straight from the pages of storytelling with data: Let’s Practice!
For this month’s #SWDchallenge, we’re going to tackle the first exercise from Chapter 2, which is titled “choose an effective visual.” This is part of the practice with Cole section, which means the exercise is posed, you’re meant to solve it on your own, and then I offer my solution. Not only will this month’s challenge give you a taste of the content and style of the new book, but it will also act as a forcing function for you to complete your practice before turning the page to my solution—there’s no page to turn quite yet, as the book won’t ship for another week or two. I’ll share my solution here when we recap later this month (if you don’t want to wait that long, pre-order Let’s Practice! to be among the first to receive it!).
Here is the challenge (full submission details follow):

Exercise 2.1 | Knaflic, Cole. Storytelling With Data: Let’s Practice! Wiley, © 2019.
In case you’d like a refresher of some common visuals used when communicating data in a business setting, here’s the SWD chapter recap that precedes this exercise in the book:
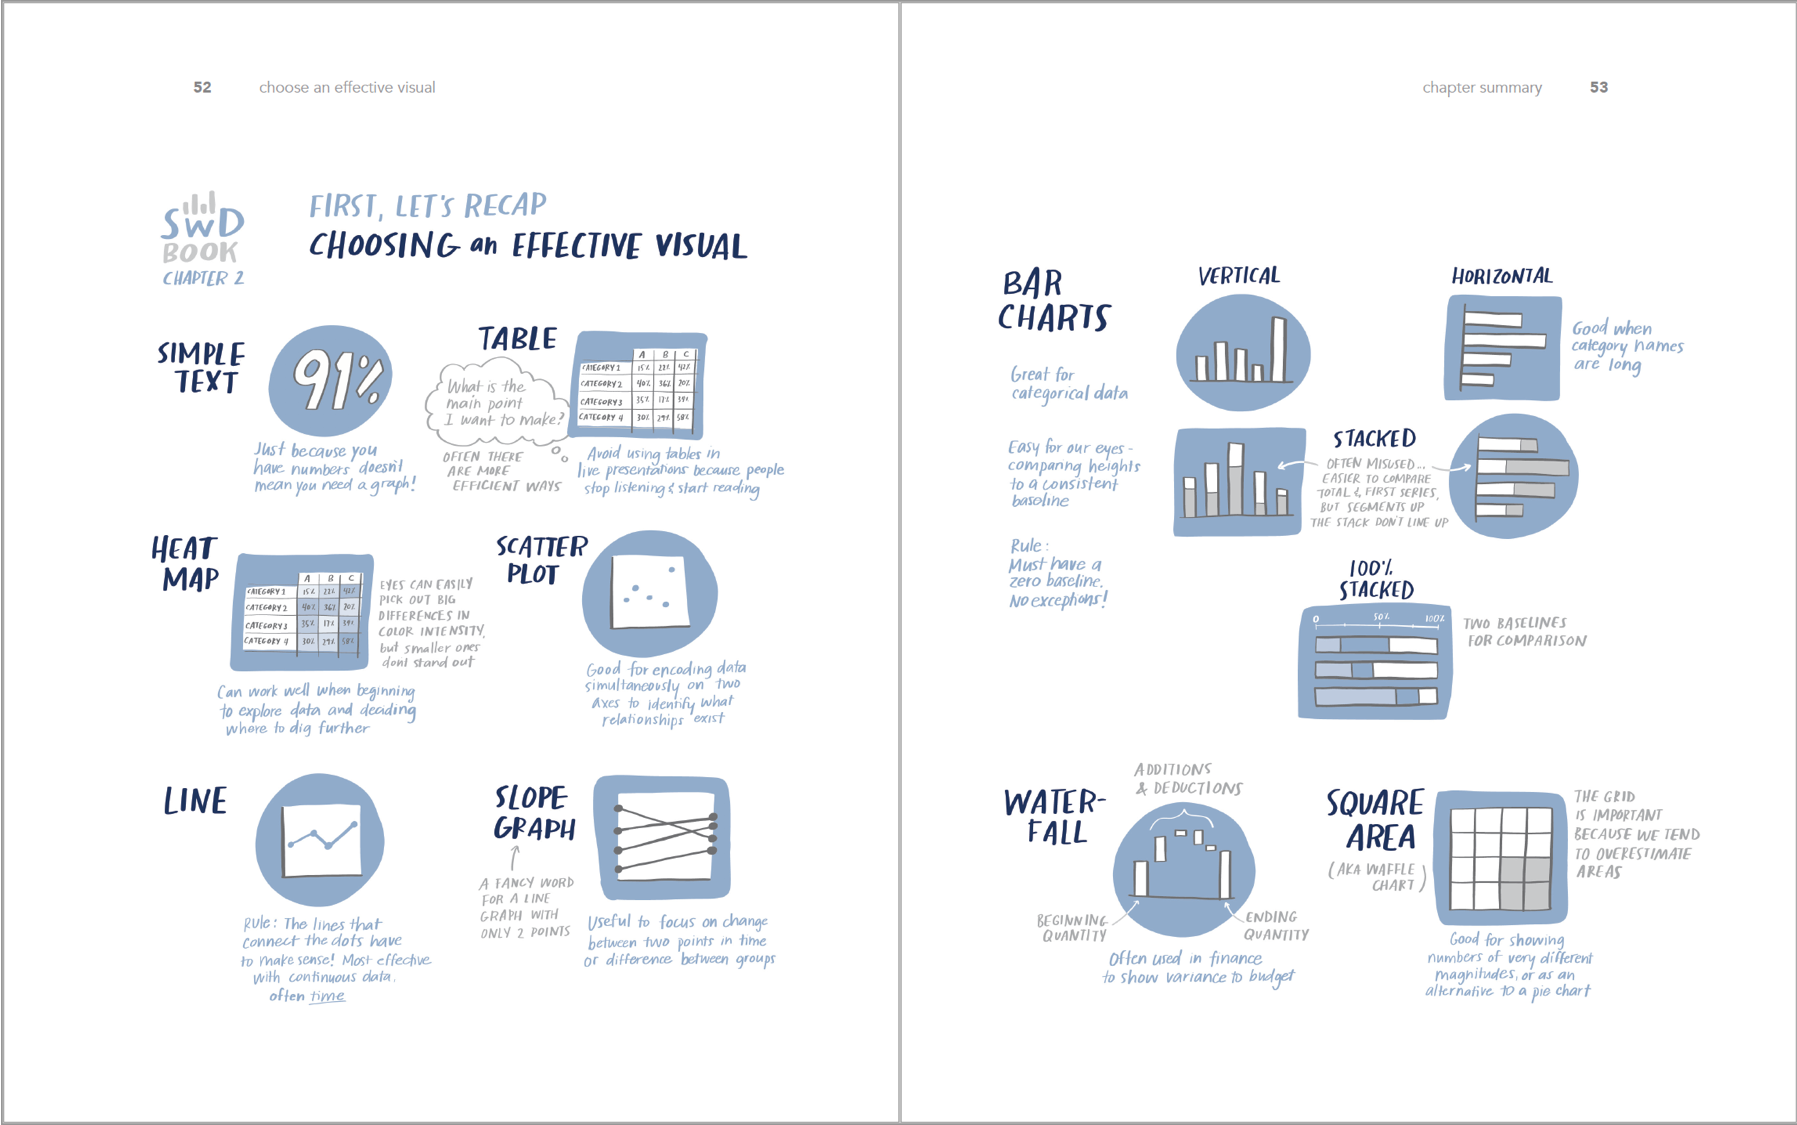
Chapter 2 recap | Knaflic, Cole. Storytelling With Data: Let’s Practice! Wiley, © 2019.
Here’s what you need to do to participate:
CHALLENGE: Download the data and solve Exercise 2.1 using the tool of your choice. Share the visual you create in Step 3, following the submission instructions below.
DEADLINE: Wednesday, October 9th by midnight PST.
SUBMISSION INSTRUCTIONS: upload your visual and related commentary via at storytellingwithdata.com/SWDchallengeSUBMIT. Feel free to also share on social media at any point using #SWDchallenge. For inclusion in the summary recap post, submissions must be officially submitted to us (still a time-intensive process and we aren’t able to scrape Twitter and other social media sites).
Stay tuned for the recap post in the second half of the month, where we’ll share back with you all of the visuals created and shared as part of this challenge—including my solution from Let’s Practice!
For 100+ additional exercises that will help you hone your data storytelling skills, pre-order your copy of Let’s Practice! today. Also check out the #SWDchallenge page for past challenge details and recaps. I’m excited to see your solutions this month, as we all practice together and hone our data storytelling skills!