what is a line graph?
This article is part of our back-to-basics blog series called what is…?, where we’ll break down some common topics and questions posed to us. We’ve covered much of the content in previous posts, so this series allows us to bring together many disparate resources, creating a single source for your learning. We believe it’s important to take an occasional pulse on foundational knowledge, regardless of where you are in your learning journey. The success of many visualizations is dependent on a solid understanding of basic concepts. So whether you’re learning this for the first time, reading to reinforce core principles, or looking for resources to share with others—like our new comprehensive chart guide—please join us as we revisit and embrace the basics.
Line graphs (or line charts) are best when you want to show how the value of something changes over time, or compare how several things change over time relative to each other. Whenever you hear that key phrase “over time,” that’s your clue to consider using a line graph for your data.
Line graphs are common and effective charts because they are simple, easy to understand, and efficient. Line charts are great for:
Comparing lots of data all at once
Showing changes and trends over time
Including important context and annotation
Displaying forecast data and uncertainty
Highlighting anomalies within and across data series
On the other hand, they are not necessarily your best choice for:
Displaying quantities of things
Working with categorical data
Making part-to-whole comparisons
Showing sparse data sets
In this post, we’ll talk about how a line graph works, and how to build one that provides meaningful information and context to your audience.
Then, we’ll answer some commonly asked questions about line graphs:
In future articles, we’ll go into more detail about some special variants of line graphs, like the slopegraph and the area graph.
How does a line graph work?
Think of the lines on a line graph as little histories.
First, we measure the value of something we want to keep track of at different points in time. For example, at the end of every month, our store wants to record how much money we brought in through sales.
Once we have lots of these measurements, we plot those points on our graph, and then draw a line that connects those points, to make it easier to see how those values rose, fell, or stayed the same over time.
But that’s not all we can do with line graphs!
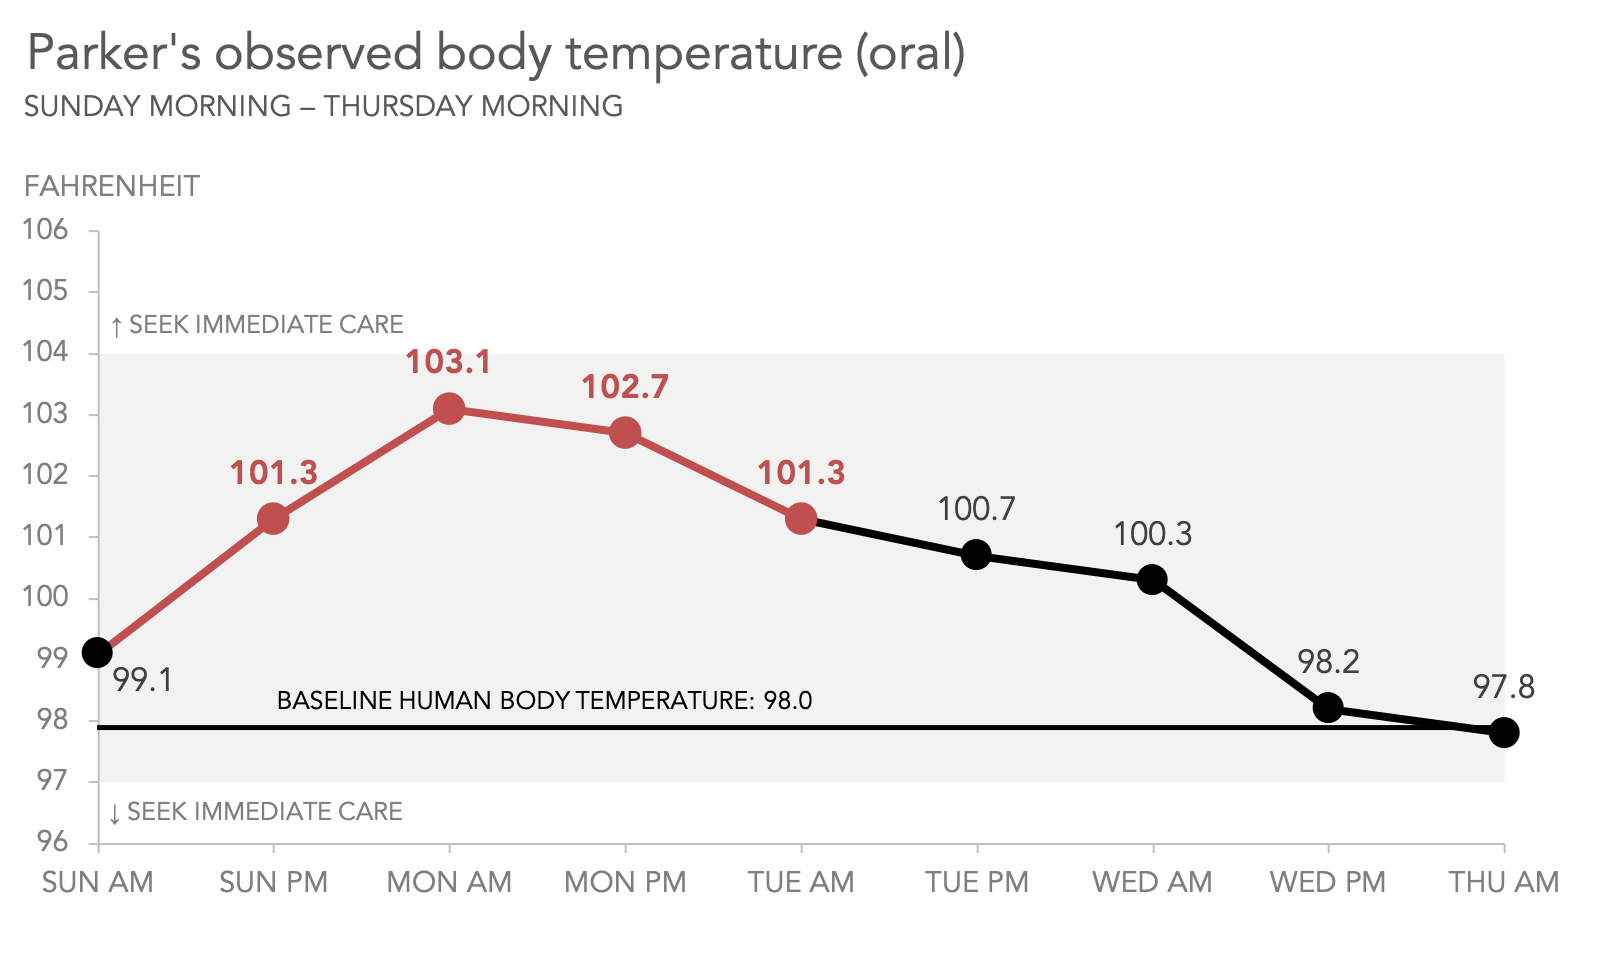
In addition to drawing that line, we can include other important contextual information on our graph. We can choose to mark, label, and/or annotate individual points on our line; we can add reference lines and regions; we can even include forecast data points, and distinguish between actual and projected data by changing the look of our line and our data markers.
Here’s what a chart like that could look like.
Our collected sales data is still shown on the chart, as the solid black line, but now we’ve been able to put that data into context.
A gray reference band shows what the range of monthly sales totals have been, and we’ve labeled those specific values as well.
A green line shows us what our sales goal is, to make it easy to see if our sales numbers were worth celebrating in any given month.
To reduce some visual clutter, the data labels and most of the markers of individual points on our line have been removed. Only the markers for the months in which we hit our maximum and minimum sales values remain, because they are important to the story we plan to tell with this graph.
A dotted line shows the projected sales over the next three months.
Annotations at key moments in time explain the reasoning for the numbers, actions we took in response to those numbers, and our expectations.
Remember: line graphs work by emphasizing how our measured values change over time, or as a specified independent variable changes. We can take advantage of the white space in our line graphs to include informative context that helps an audience understand why these specific changes matter.
What kind of data can be used on a line graph?
A typical line graph will have continuous data along both the vertical (y-axis) and horizontal (x-axis) dimensions. The y-axis usually shows the value of whatever variable we are measuring; the x-axis is most often used to show when we measured it, either chronologically or based on some independent variable (e.g., as we rev our old car’s engine, we measure the decibel level at different RPM).
While some line graphs do not use continuous data on the x-axis (particularly slopegraphs and parallel coordinates diagrams, which are specialized variants of line graphs), what we absolutely can’t use on our x-axis is data that doesn’t have any meaningful relationship among the categories shown.
Let’s say we have a list of the first six months of 2020: January, February, March, April, May, June. It would feel wrong to list them in any other order, because they are continuous and have an intrinsic order. January 2020 leads to February 2020, which leads to March 2020, and so on.
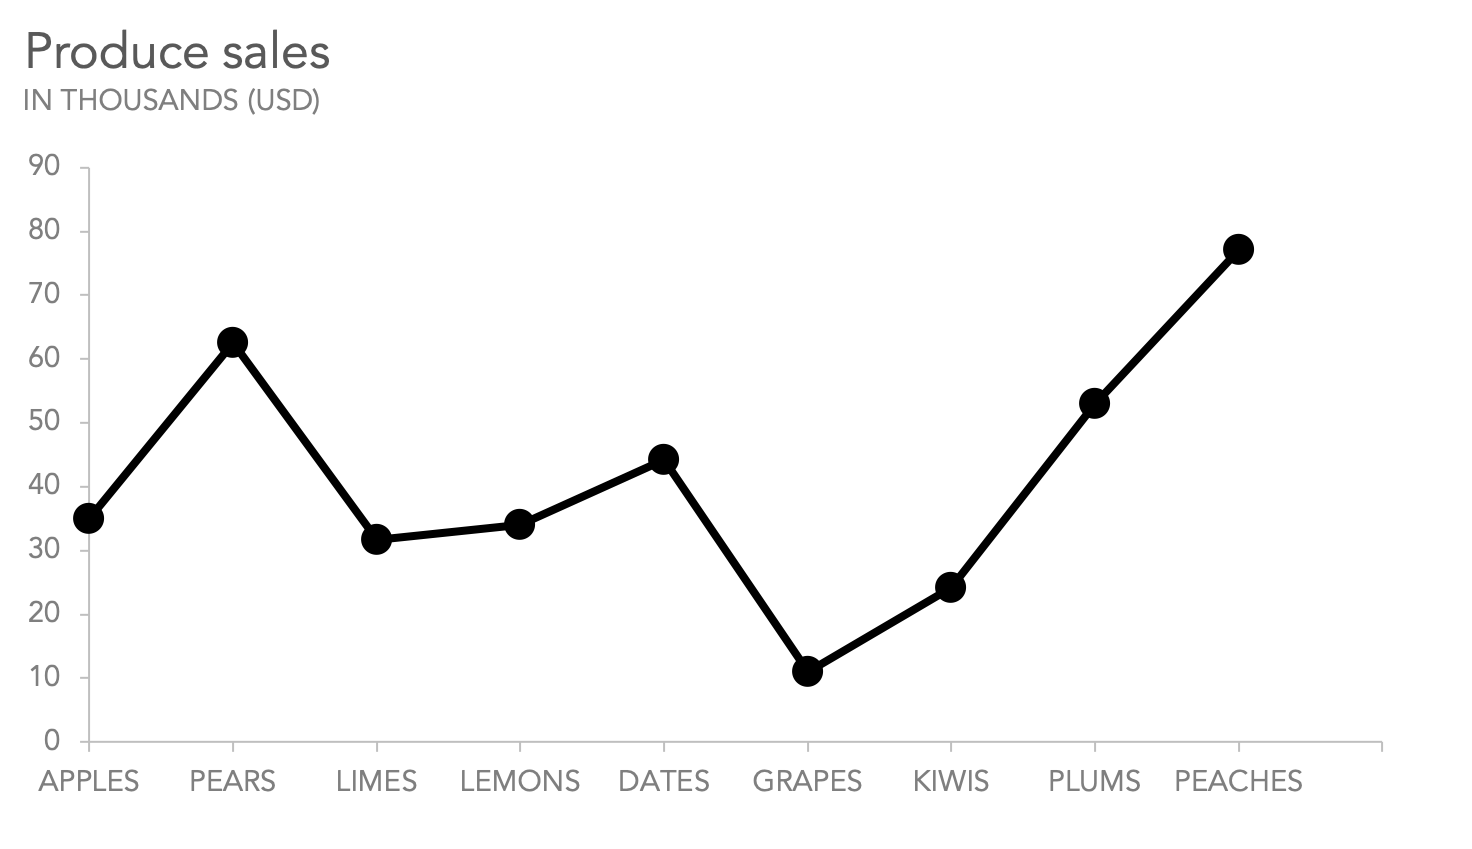
Let’s also say we have a list of types of produce: apples, pears, limes, lemons, dates, grapes. Unlike our list of months, one kind of produce doesn’t necessarily lead to the next. We could order them alphabetically, by size, by color, or randomly, and it wouldn’t feel unusual, because they have no intrinsic order, and are not continuous—they are categorical.
Line graphs only make sense when there is a meaningful relationship between successive points on the line. Therefore, a grocery store could reasonably use a line graph to show their produce sales data by month, but using one to show sales differences among various types of produce isn’t recommended. That would be better done in a bar chart.
How many different lines can I put in one chart?
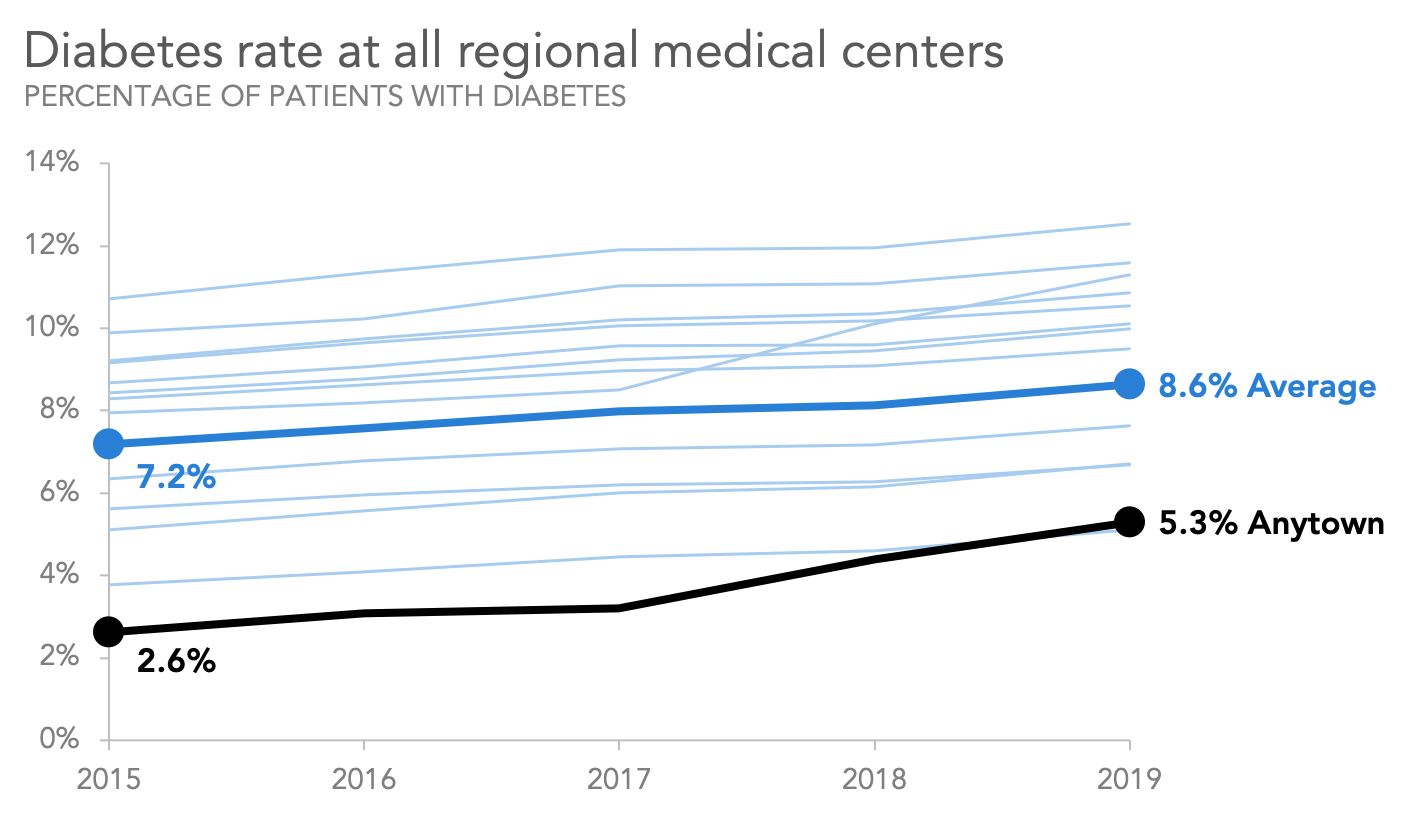
People have a hard time keeping track of more than four or five things simultaneously, so consider using that as your guideline. If you absolutely need to show more lines than that, try to use color, line weight, and labeling to focus on the most important lines or points.
This graph above shows five years’ worth of data for annual diabetes rates of patients at our local medical center, Anytown Medical, as well as the rates for 12 other centers in our region. Since what we are likely to care about the most is our own center (particularly because our rates are low), we are using color, weight, and labeling to bring focus to Anytown and to the regional average, while also including the values for all other centers.
Does the y-axis of a line graph have to start at zero?
When we look at line graphs, we compare the lines to each other more than their height from the x-axis. By their nature, line graphs are better at showing the change of values over time than an exact quantity at each measured point.
Line graphs, therefore, are not required to have a zero baseline; but in most cases, it is still advisable. It is less confusing to an audience if the y-axis starts at zero, since that is the normal expectation when seeing a chart for the first time. There should be compelling reasons to subvert those expectations.
Here are some specific cases for which a zero baseline might not be optimal:
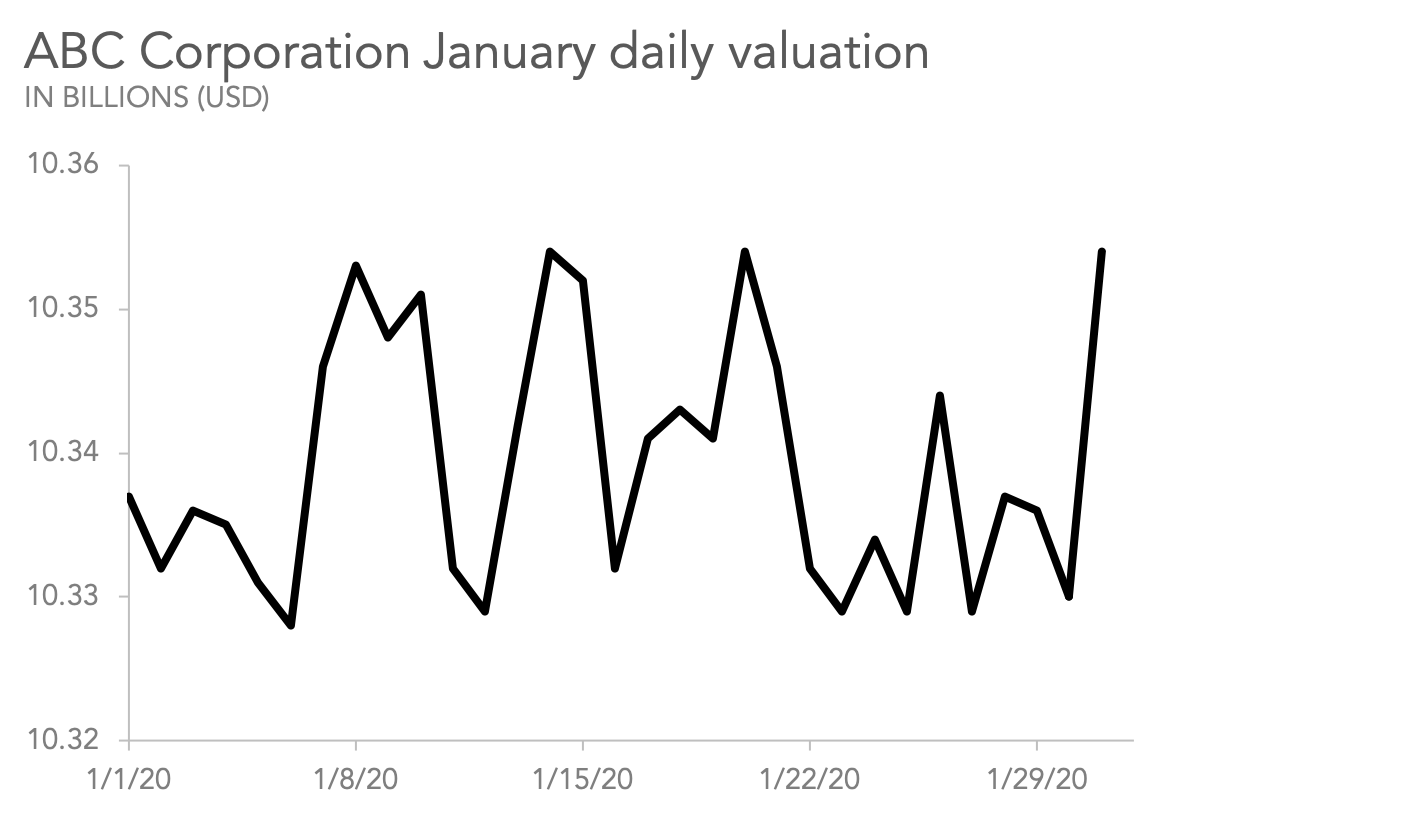
The range of measurements is small, but the distance from the minimum value of those measurements to zero is large.
If our y-axis went all the way down to zero, these meaningful fluctuations would be impossible to perceive.
The relationship to zero is not meaningful.
On some scales, like on a Fahrenheit scale, the position of “zero” is somewhat arbitrary (50 degrees isn’t twice as warm as 25 degrees), so if no data point would ever come close to zero, we shouldn’t feel obliged to include that as our baseline. Our graphs should include a range of reasonable values, providing the most meaningful context to a viewer.
Some of your measurements are negative.
It might be important to include a horizontal line as a reference point for zero, but no data series on our graphs should cut across either of our axes. It’s preferable to make the minimum value of our y-axis lower than the minimum measured value of our data, so that our baseline is a boundary line for our data.
IMPORTANT! In situations where your line graph has a non-zero baseline, it’s important to make that fact obvious to your viewer, so they are not misled by a zoomed-in perspective on your data.
How much space should I leave at the top and bottom of my graph?
The specific answer to this question will vary with each graph you make. A useful starting point is to make the range from your smallest value to your largest value take up about 70-80% of your graph’s available vertical space, with a roughly equal amount of white space above and below it.
From there, you can modify your axis range, and the position of the line or lines plotted on the graph, to suit your specific needs. The relative slopes of your lines won’t change, so do your best to select an axis range that lets you have round numbers for your axis labels, a reasonable amount of white space in the chart to include data labels and annotations, and is wide enough (if necessary) to show reference lines, like goals or projected values, that might be bigger or smaller than your smallest or largest measured value.
In every case, it’s important to be reasonable and thoughtful in how you present the data, in order for your audience to understand your message clearly.
Now that we’ve talked about all these different elements of line graphs, the next step is to make some of your own, using whatever tool or tools you prefer. The storytelling with data community would be a great place to start! Try any or all of these quick exercises:
You could also look back on some of our prior #SWDchallenges, like this one about annotated line graphs, to see what some of your fellow communication enthusiasts have created.
Or, continue your journey through our full what is…? chart series, by browsing other common visuals like bars and pies, or explore our comprehensive chart guide page for additional chart types.
