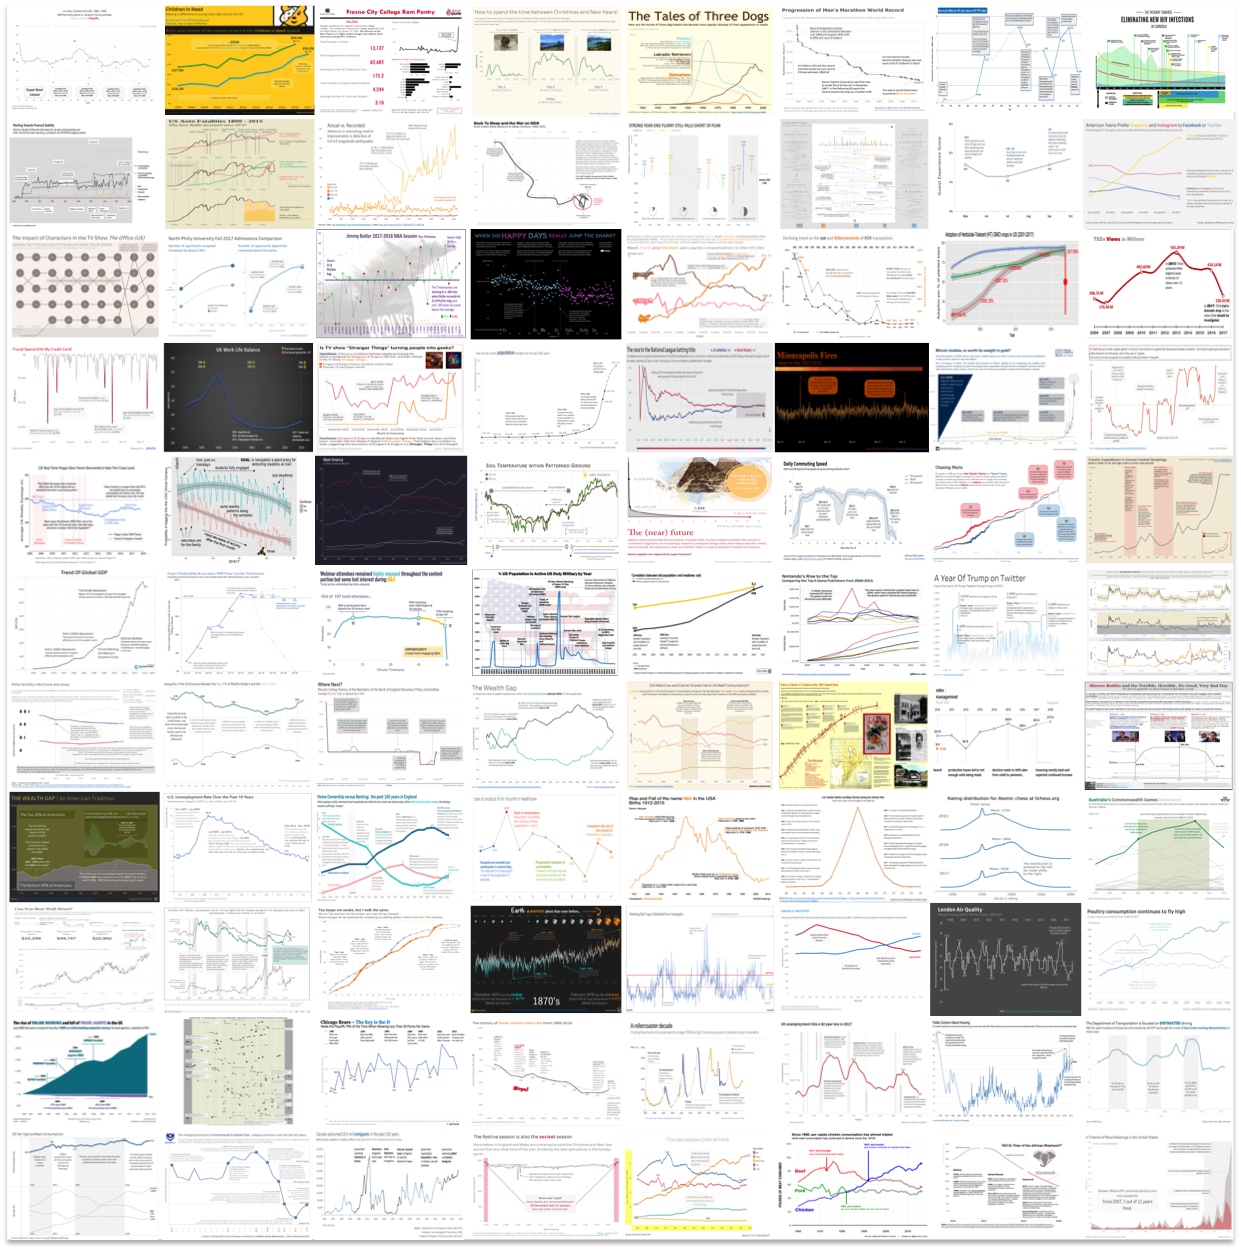
88 annotated line graphs
In our first challenge, 88 people submitted annotated line graphs with huge variety of tools. Click the link below to see the full recap post, including each submission and related commentary.
introducing the 2018 #SWDchallenge
The inaugural challenge was an annotated line graph. Lines are most often used with continuous data: days, months, quarters, years. Click the link below to see the full details, including an example and submission instructions.

