from dashboard to story
More and more organizations are turning to dashboards for monitoring performance and enabling data exploration. These user-friendly reporting tools offer a ton of advantages over older ways of doing things: they can dynamically update to display the latest information, link together multiple views of data, and often incorporate interactivity that lets users filter and zoom in on what they want to explore.
As powerful and as useful as dashboards are, they’re optimized for the exploration of data, not the communication of specific insights. Once we’ve used our dashboards to uncover something worth sharing, we’ll usually be better served by making a separate presentation, designed to bring the findings to light and get others to act upon the information.
The path from dashboard to story might not always be intuitive. This article will use a dashboard from a recent storytelling with data engagement to illustrate how to transform dashboard insights into an action-inspiring story.
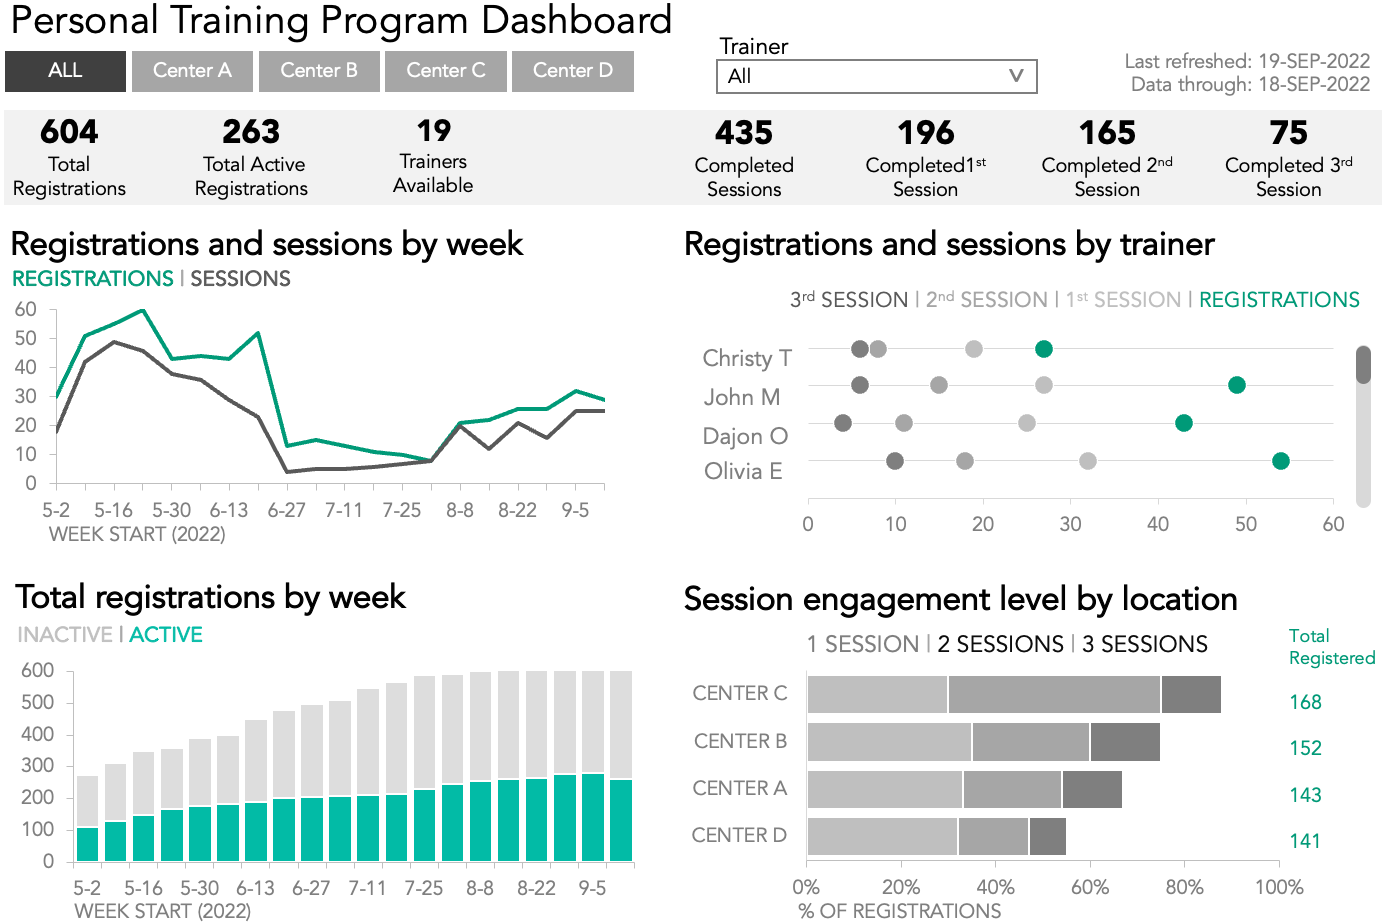
First, some background: a fitness chain created a dashboard to monitor weekly performance metrics for a personal training program. In this program, clients at the fitness center register to attend one-on-one sessions with a certified trainer.
Filters at the top of the dashboard allow users to select and analyze specific locations and trainers. Overall summary measures are shown in prominent colored boxes just below the filters, and there are four charts that provide time-trended views and aggregated metrics by week, trainer, and location.
With this dashboard and others like it, exploring the data was much easier than ever before, but the client found it challenging to translate the results of that exploration into actionable insights that leadership could quickly understand.
Make a dashboard easier to read
Many of the lessons taught in our books are specific to making explanatory communications better by using techniques like focusing and telling a story. Since dashboard visuals update when filters are applied and data is refreshed, it is difficult to add specific text or focus attention on a particular data point to tell a compelling story. However, some of the storytelling with data lessons do apply.
Keep your audience in mind
When creating a monitoring report capable of exploratory analysis, one should be thoughtful of the audience, and the insights they need to glean from the data. To improve the overall user experience, leverage white space, alignment, and grid layouts. This will make the view easier to read and navigate at all levels of exploration. For more tips on designing effective dashboards, check out The Big Book of Dashboards.
Choose effective visuals
To enable quick discovery, select the most appropriate chart type for the data being depicted. Some of the charts in our dashboard would be easier to interpret as a different visual. For example, a line graph would show the trends for registrations and sessions better than bars. A dot plot would enable a simpler view of trainer sessions, while stacked bars would provide a relative comparison of each fitness center location.
Identify and eliminate clutter
Because dashboards are naturally busy, we certainly want to take steps to reduce the cognitive burden for users by removing items that do not add information value, like gridlines and borders. The amount of color used can also contribute to a cluttered feeling.
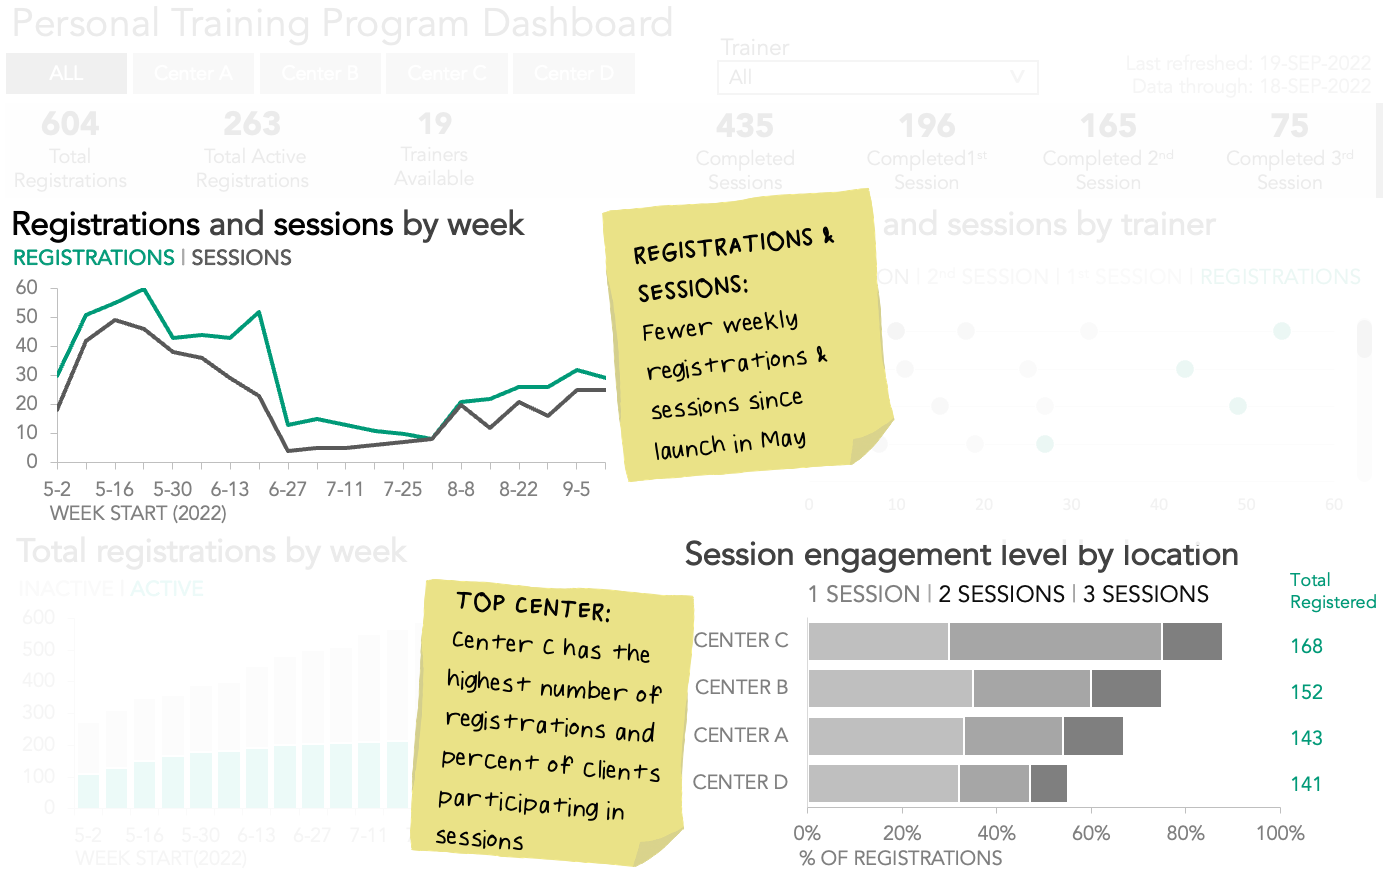
In this simplified version of the dashboard, we’ve made it easier for our audience to see the data clearly by minimizing the number of data labels, borders, and colors.
Exploring data is different than explaining data
Dashboard interactivity makes data discovery much easier, but to drive meaningful change, it is usually more effective to craft a communication specific to the story we want to tell. Creating a presentation tailored to our audience lets us deliver our findings in a way that will resonate with them, and frees us from having to compete for attention with unrelated charts, filters, and text.
Isolate data from your explorations that support your specific message
In a presentation, we don’t need to share every bit of data we looked at in dashboards throughout the exploratory process. The point of looking at all that data was so that we could isolate the critical insights, and share those directly with decision-makers. Providing too much data runs the risk of overwhelming our audience.
A more effective approach is to include only the most meaningful information needed to support our main message, or what we like to call the Big Idea. After crafting our Big Idea, we can use it to identify what data is necessary for our story—and what we can leave behind on the dashboard.
Imagine we oversee the personal training programs across all of the fitness center locations, and after reviewing the dashboard, we realize two important things.
Registrations and sessions have tapered off since launching in May. Our summer promotion was effective at getting clients to register for the program, but if we want to continue to grow the number of people we help through the program, we likely need another marketing push leading into the holiday season.
Some centers are doing a better job at getting registered clients to attend multiple sessions and there are likely some strategies we could learn from these locations.
As a result of these findings, we want to meet with the head of marketing to discuss how to drive more awareness and engagement for the program. Our Big Idea might be: To help more clients meet their fitness goals, we should develop a new marketing strategy for our personal training program and apply learnings from successful engagement tactics across all locations.
Since we want to have a targeted conversation with the head of marketing, we do not want to share the entire dashboard, as it includes additional data that could distract from our key takeaways. Instead, we want to isolate just the pertinent information. Using our Big Idea as a filter to identify the data needed as evidence, we focus on the two graphs highlighted below.
Now that we’ve identified our audience, articulated our Big Idea, and found the data needed to support our message, we are well-positioned to create our communication to the head of marketing.
Use words and color strategically
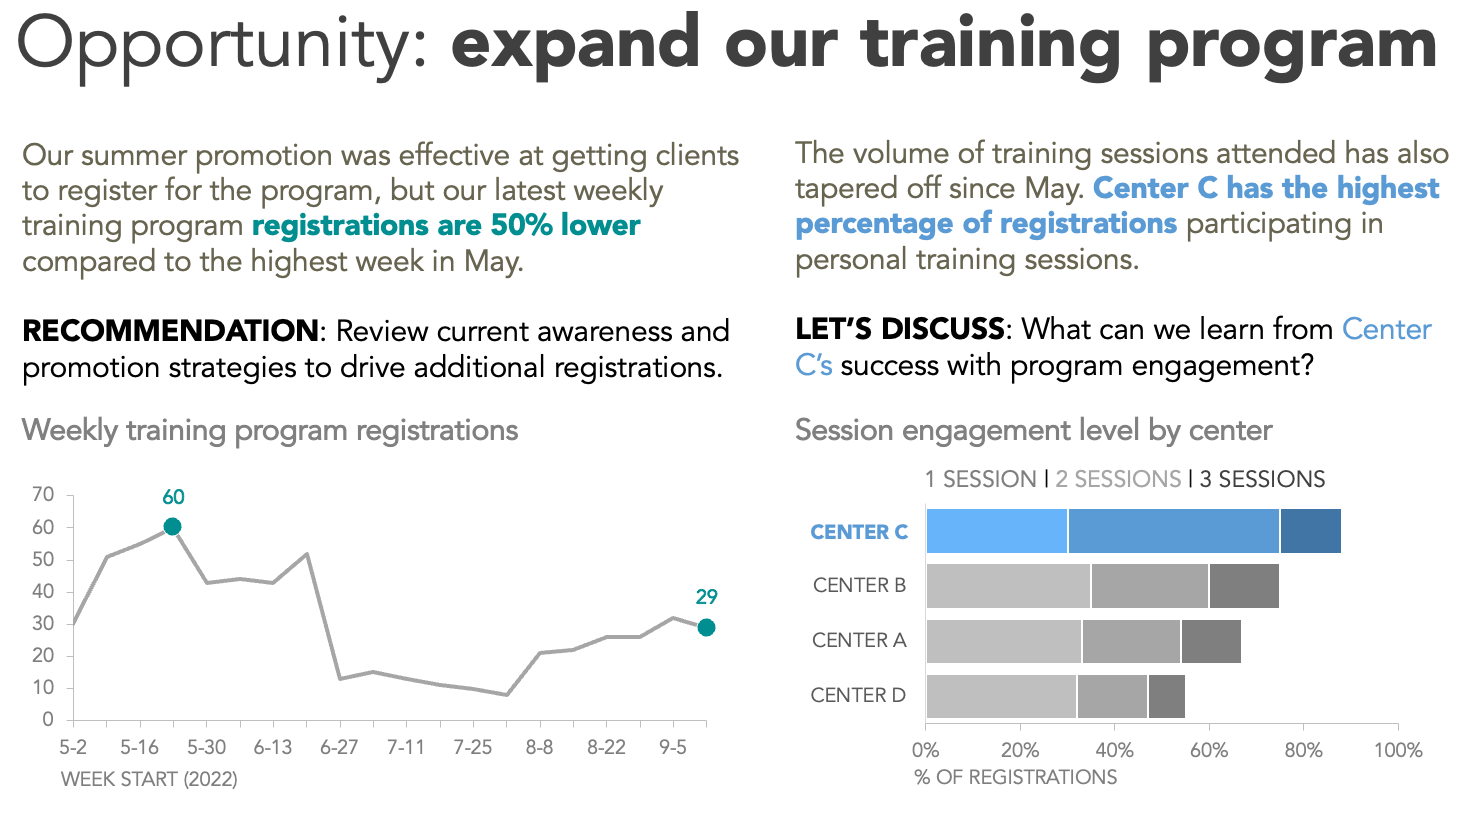
Words and color are a powerful combination for highlighting key points in our communications. By taking the data out of the monitoring report, we can more easily get our audience to notice the most important information. Check out how we can immediately call attention to the lower number of weekly registrations by using color sparingly paired with words.
Explicitly communicating our findings in words and recommending an action makes the so-what clearer to see. We use the same color in our emphasized words as we do for the key points in the graph, so there is a visual link letting the viewer know how the data and the recommendation tie together. Notice how these little changes make the story unmistakable.
To create an effective single-slide executive summary, we can incorporate an active slide title and call out the recommended action directly, to facilitate and encourage a conversation with the head of marketing about the next steps for promoting our personal training program.
All this insight was present in the original dashboard, but executive leaders with limited time and bandwidth can’t be expected to do all the exploration necessary to find it for themselves. Interactive tools are incredibly useful for getting to insights more quickly, but when we need to present compelling stories that drive our audience to act, a separate and more focused communication is often more effective.
To practice transforming a dashboard into a story, check out this related community exercise. We also welcome further thoughts on dashboard stories in this related conversation.
If you enjoyed this makeover, you’ll appreciate our upcoming book, storytelling with data: before & after, which features 20 transformations ranging from graphs and emails to full-blown presentation slides. The book will be available September 2025, but you can download 3 sample chapters today.


