Develop your data storytelling skills with our online learning options
Learn at your own speed, from the comfort of your own space, and gain practical experience applying your data storytelling skills.
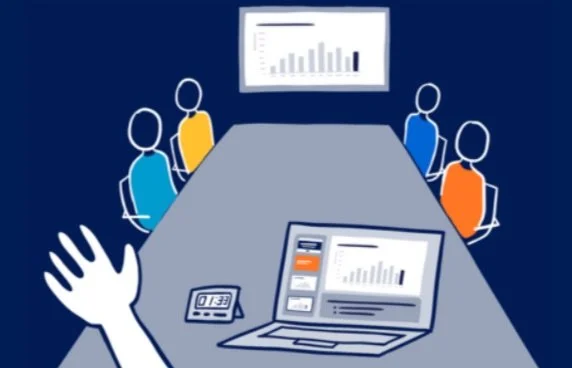
In this course, you will learn strategies for good slide design and tactical tips for applying them in your next presentation. We will teach you by example, taking you step-by-step through how the storytelling with data good-to-great mini-workshop slides were created in PowerPoint.
Through step-by-step video lessons, you'll master scatterplots, box plots, bubble graphs, radar charts, and horizon charts. With optional exercises to reinforce your learning and additional resources for other graph types, this course will elevate your data presentation skills.
Access our full learning library through annual premium membership
✓ Lifetime access to all on-demand courses
✓ Over 45+ hours of additional video content
✓ Regular office hours to chat with SWD team
✓ Special discounts on SWD offerings
✓ Exclusive access to live virtual events
✓ Early access to new offerings & content
$399 per year
Discover more ways to learn with us
ORGANIZE A CUSTOM TEAM TRAINING
JOIN A PUBLIC WORKSHOP
EXPLORE OUR YOUTUBE CHANNEL
Frequently asked questions
-
For those who’ve already read the books, our on-demand learning will reinforce the concepts and go deeper into how to apply the specific concepts to your own work.
-
We welcome all skill levels. Whether you’re an analyst crunching numbers; a manager needing to communicate in a data-driven way; or a leader responsible for presentations to your board, execs, or other stakeholders; our on-demand learning will guide you through creating effective graphs and slides.
-
Follow SWD on LinkedIn, or join our mailing list to be notified about new sessions.
-
We never want cost to be a barrier to learning. We offer group (5 or more), educator, student, and non-profit discounts. Email support@storytellingwithdata.com for details.
-
Yes. We look forward to hearing from you. Email us at swdcourse@storytellingwithdata.com.


