redefining the analytical process
"I want to kick things off with a super important distinction: the difference between exploratory and explanatory analysis."
These are words that the rest of the team and I say at the start of nearly every presentation we do. We've experimented with removing this context in the past, only to kick ourselves and quickly add it back in.
You may wonder, “Why? What makes this distinction so important to talk about?”
Whether formally in a classroom setting or perhaps on the job, many of us were taught incomplete definitions of the data analytics process. These descriptions tended to overvalue the exploratory part of the process and undervalue—or omit entirely—the explanatory side of things.
The difference between exploratory and explanatory analysis
Exploratory analysis is the process of understanding your data. Whether it involves pulling in multiple data sets, cleaning the data, experimenting with different views, or doing statistical analysis, in some way, you are discovering your data.
Explanatory analysis occurs when you have something to say about your data. You've explored what you have and found something worthy of sharing, so now you need to do so in a manner that is both engaging and understandable to someone else.
Together and with equal measure, these two types of analysis represent the entire analytical process, especially within a business setting.
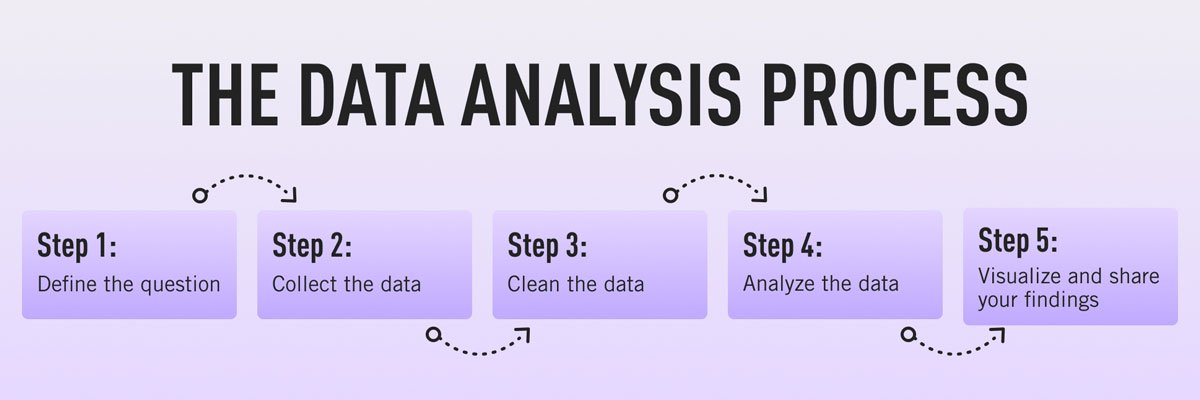
That said, a quick Google image search of “the data analysis process” yields multiple diagrams like the one below.
A result from the Google image search ”the data analysis process.”
Notice how four of the five listed steps refer to specific parts of the exploratory process. Only one step (the final one) describes explanatory analysis. The implication here is that the exploratory process is four times as important, and/or should take four times as long, as the explanatory process. I take issue with this for a couple of reasons.
Explanatory analysis is the only visible part of the process
The explanatory part of the process is often the only part of the entire analytical process that an audience will ever see. They will likely neither know nor care how long it took you to collect and cleanse the data. Those are important steps in the process, to be sure, but they’re not what we want our final product to emphasize. For the work we’ve done to have impact and drive action, we need to direct attention to the findings, conclusions, and recommendations.
In other words, the communication part is the make-or-break moment. Given its importance, we shouldn't list explanatory analysis as a catch-all step for everything related to communicating data. Doing so makes it more likely for people to rush through this important stage.
Explanatory analysis takes time to do well
Similarly, considering all communication tasks as just one single step makes the explanatory process feel unrealistically quick and easy, compared to the exploration part. As someone who exclusively focuses on explanatory communications (my official title is data storyteller), I can assure you that is not the case.
To do your exploratory work justice, you often need to curate something specifically for your intended audience. It’s not as simple as just making a quick visual with the default settings and sending it to someone else.
Start the explanatory process by getting clear on who your audience is, what their needs are, and what context they already have. Then you can decide which data is most relevant to include, and which is merely incidental.
In terms of visuals, the ones you used for exploratory analysis (scatterplots, correlation plots, bubble graphs, dashboards, etc.) likely won’t work in the explanatory space—at least not in their raw form. You’ll need to create new visuals or spend time formatting existing ones that highlight your message.
Finally, consider the format and context of your final deliverable. Are you building a report or a summary slide? If so, you must write the explanation and edit your words. Will you be speaking live in front of an audience? Then you’ll need to make slides and practice your speech.
In the same way that exploratory analysis is broken down into four steps in the above graphic, explanatory analysis deserves the same level of respect.
Redefining the analytical process
With all of this in mind, I propose we re-examine how we think about the analytical process. Let’s expand the explanatory step to clarify that communicating data is not just about graphs and charts. It’s much more strategic when we think about capturing someone’s attention and persuading them to act in a certain way.
If I were to broadly categorize the above tasks, I’d outline the explanatory process in three stages: plan your communication, create your content, and prepare to deliver. This is the same process described in much greater detail in our latest book, storytelling with you.
This shift in perspective does not imply that we will spend roughly equal amounts of time on both the exploratory and explanatory pieces. I still anticipate that exploratory analysis will take longer to complete. Generally speaking, the amount of time you spend on any one stage will differ with each project. Too often, though, people spend more like 5% of dedicated time on explanatory analysis—or worse, none at all. This is the mindset that needs to change in order for an analysis to be valued and accepted by others. Our findings must be contextualized, explained effectively, and framed in a way that prompts meaningful action.
Clear and compelling communication doesn't just happen. It takes time to pull together thoughtfully, so be sure to allow you and your team space and resources to address this critical part of the process.
