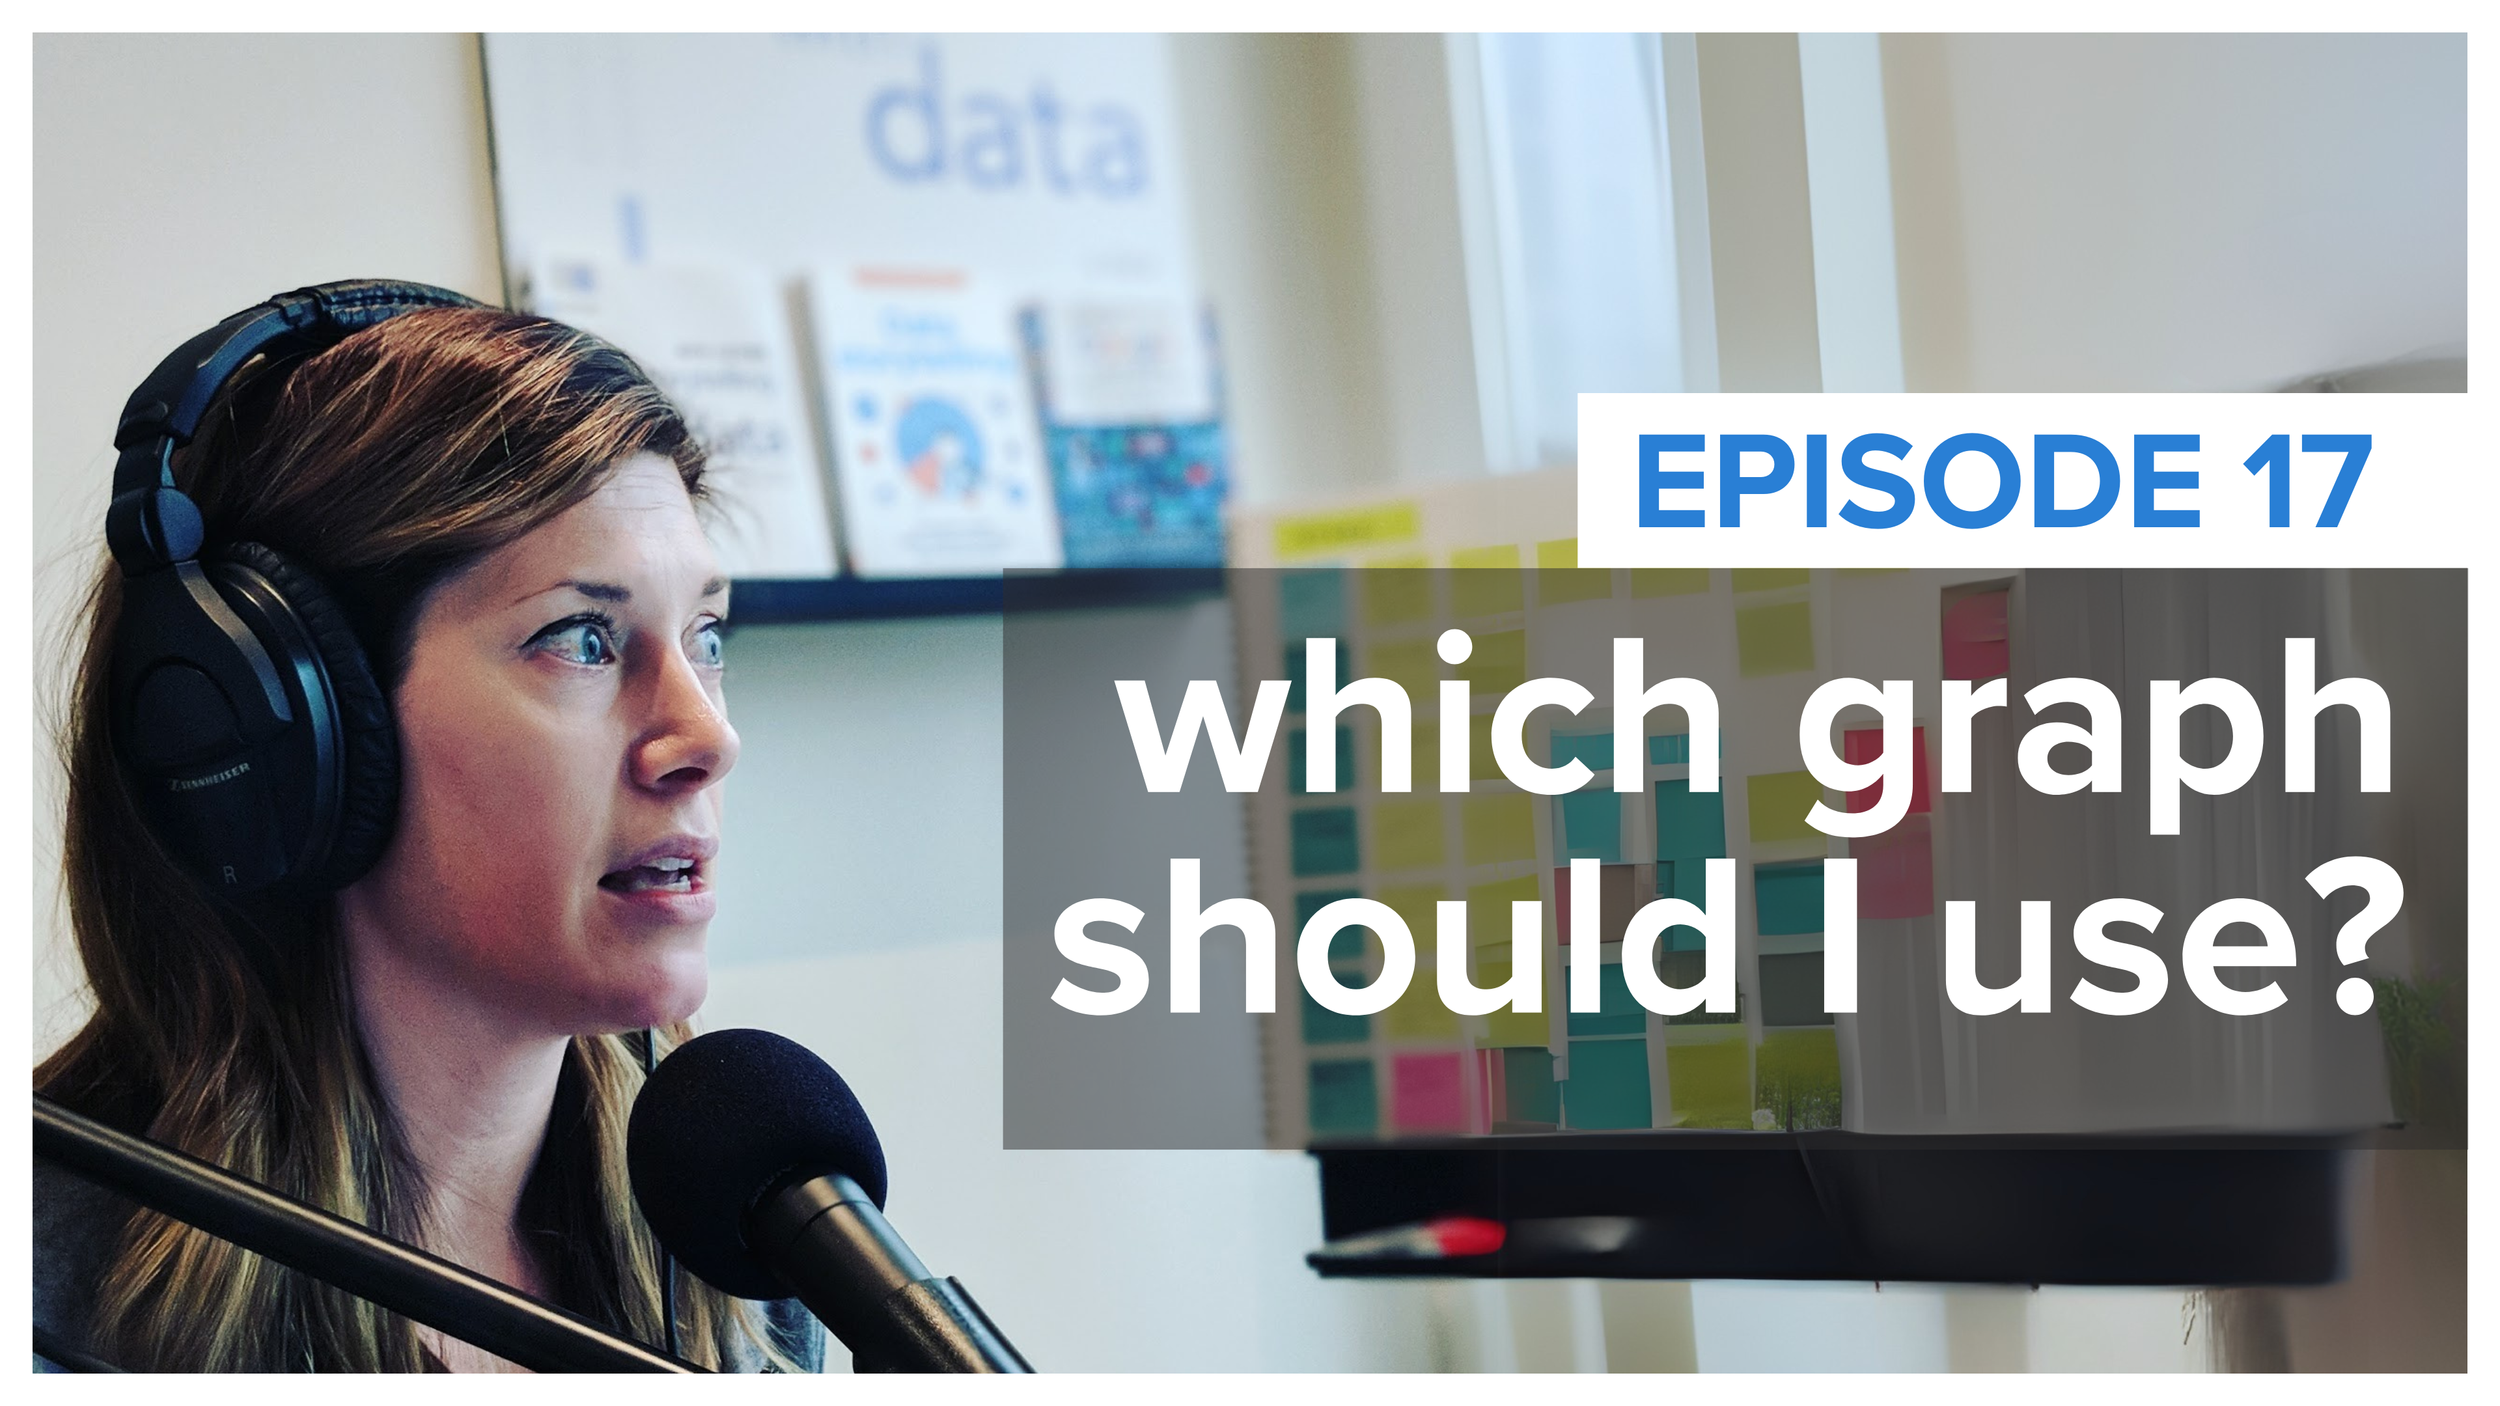
EPISODE 17
which graph should I use?
It sounds simple, yet it’s a question many people grapple with: how do I best visualize my data? In this episode, Cole reviews the most common types of graphs used in a business setting and discusses use cases and considerations. Tune in also to hear Cole address listener questions on visualizing survey results, Tableau vs. PowerBI and how to influence a client who wants default graphs rather than a data-driven story.
RELATED LINKS:
SWD blog post: grables and taphs
#SWDchallenge recap: plots with dots
#SWDchallenge recap: 88 annotated line graphs
Curved Discussion post: lines vs. bars
Flourish graph: GOT bar chart race
Data Revelations post: rethinking the divergent stacked bar
BBC Video: Hans Rosling bubblegraph
Tweet: bubblegraph GIF
Map: pasture and crop
Resource: xeno.graphics
#SWDchallenge recap: square area graphs
Twitter thread: Tableau vs. PowerBI
Register: May 30th (free!) live event
Register: upcoming European 1-day workshops
May #SWDchallenge recap: artisanal data
Questions? email askcole@storytellingwithdata.com
Follow @storywithdata | share via #SWDpodcast
WE’D LOVE TO HEAR FROM YOU
Did you enjoy this episode? Do you have ideas for future episode guests or topics? Let us know!
Listen to the SWD podcast on your favorite platform
Subscribe in your favorite podcast platform to never miss an episode.
Like what you hear? Please rate & review. Thanks for listening!


