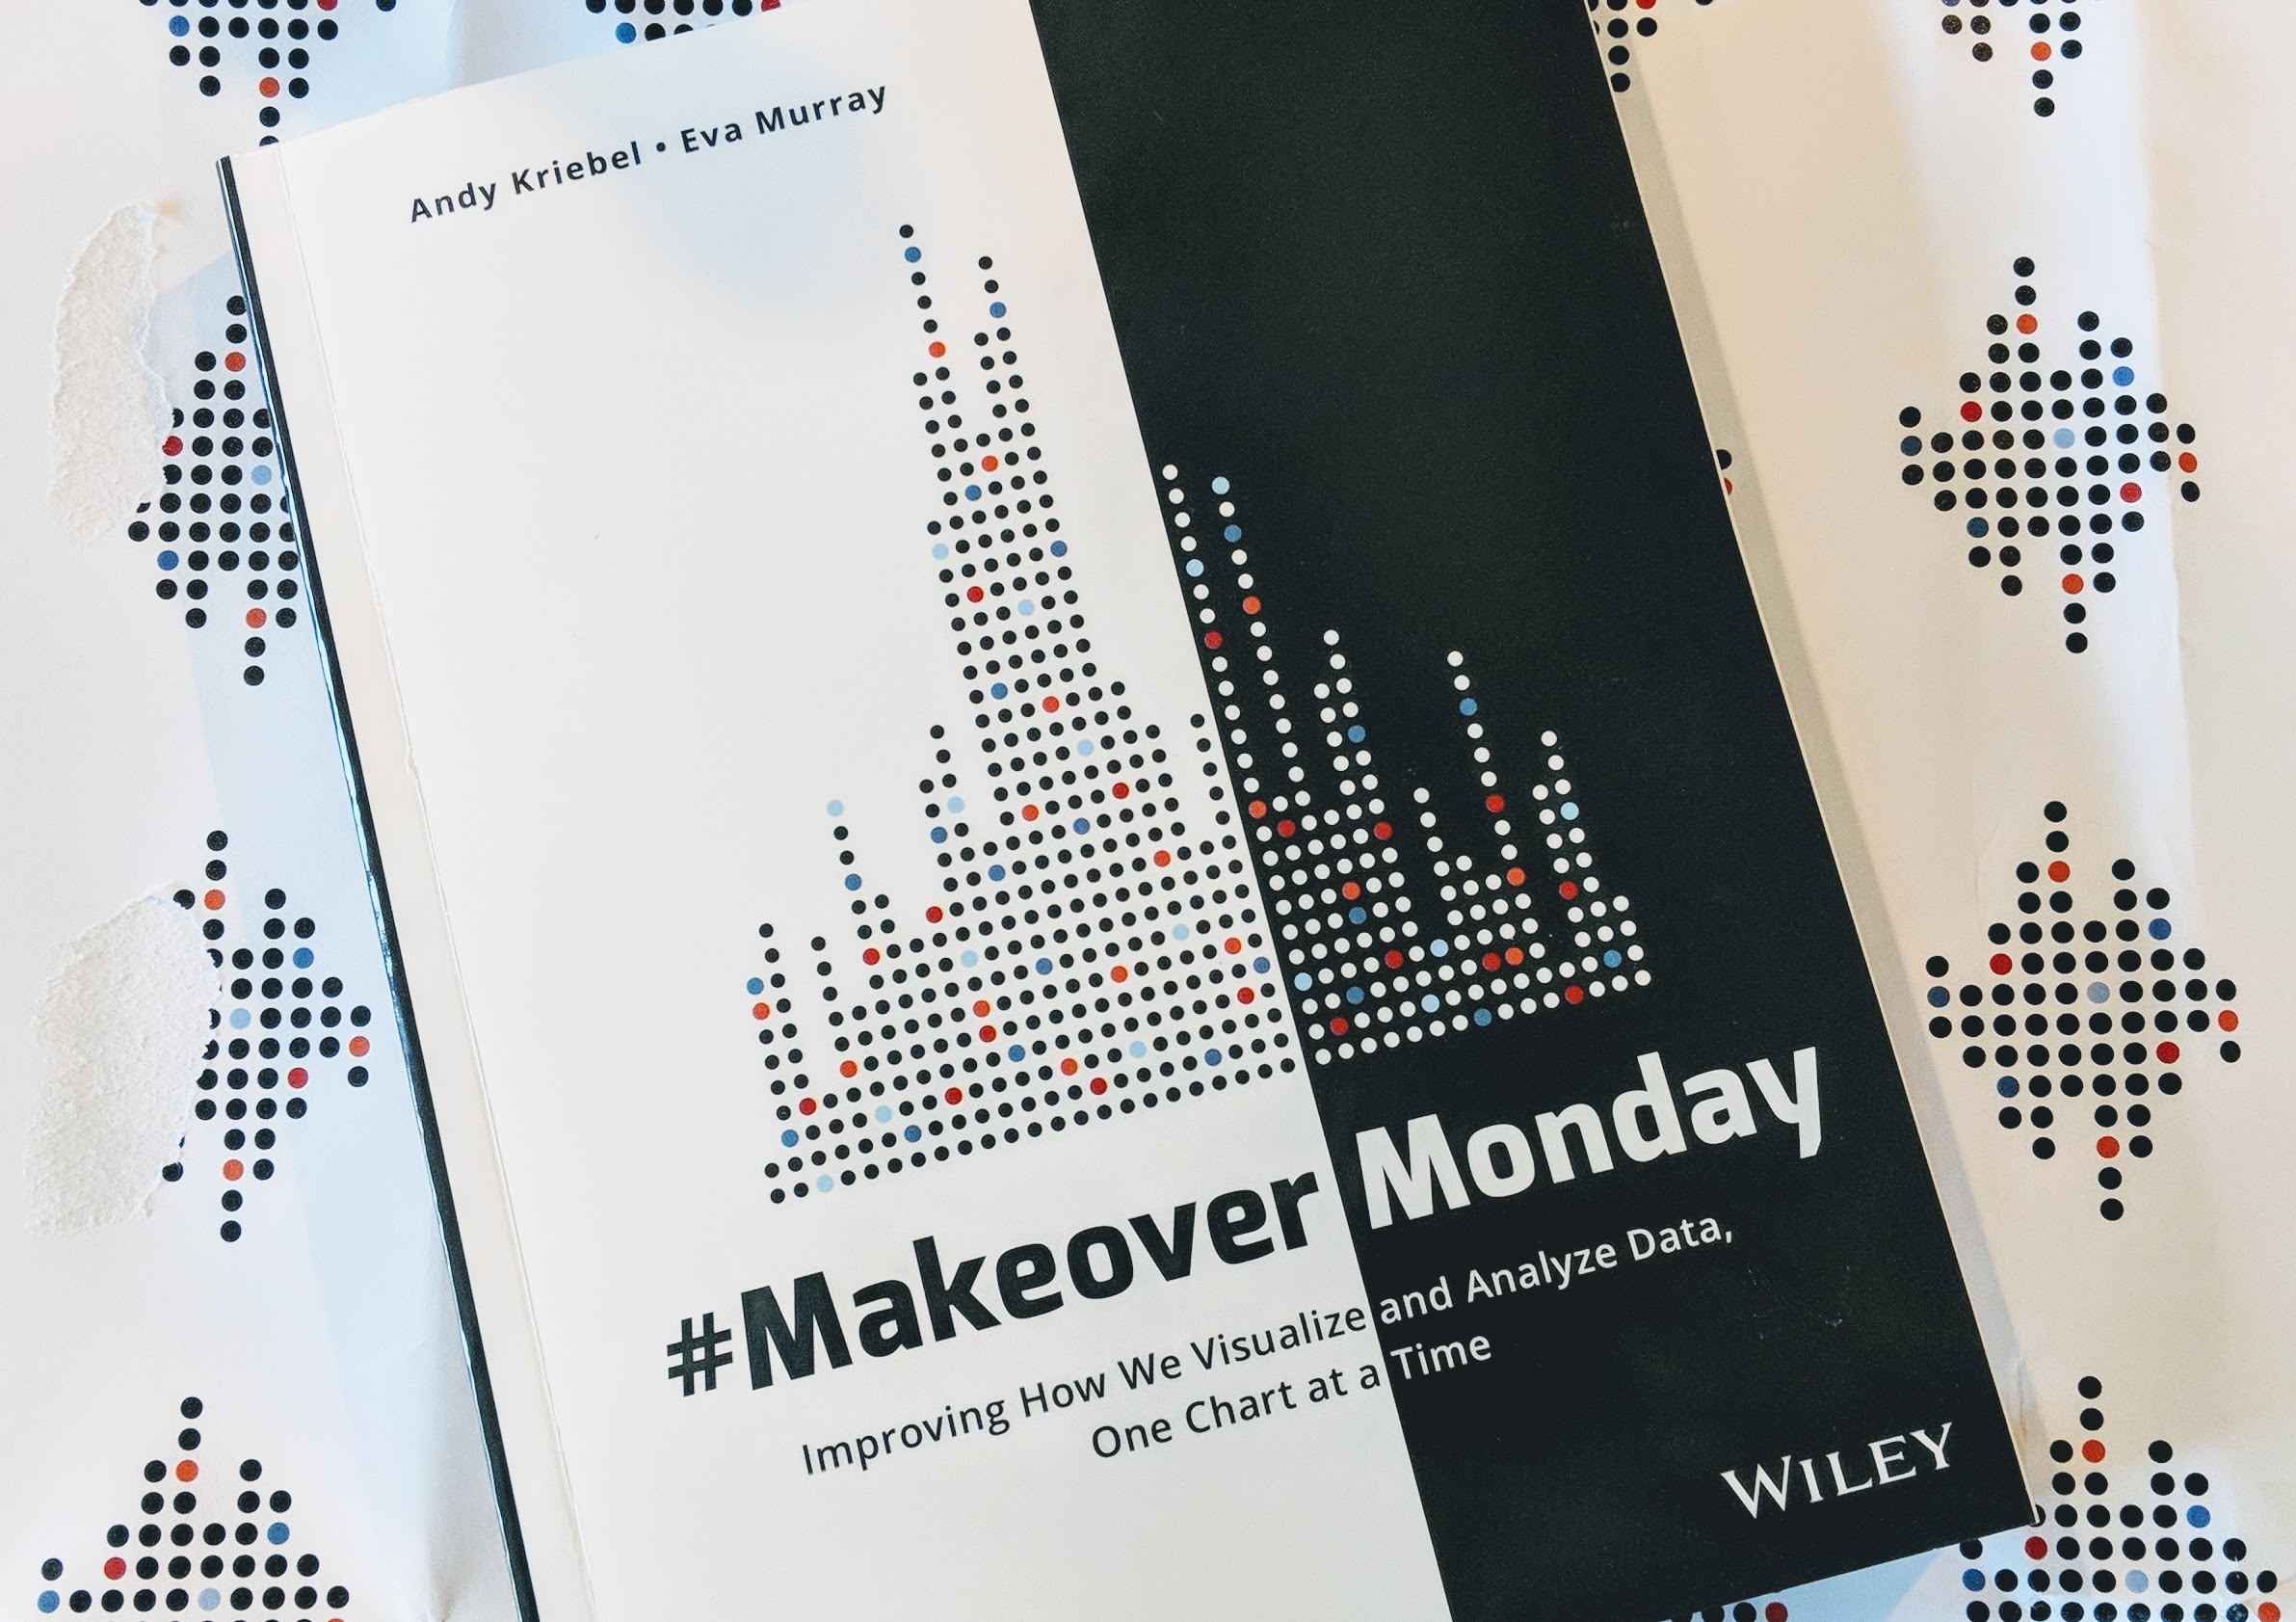
recommended reading: #MakeoverMonday
I arrived home from a trip a few weeks back to a fun package containing a thematically wrapped copy of MakeoverMonday: Improving How We Visualize and Analyze Data, One Chart at a Time. I had a chance to review and provide feedback on an early draft chapter of this book, cowritten by Andy Kriebel and Eva Murray, which was published last month.
Just yesterday, I spoke with Andy and Eva about #MakeoverMonday: the project, the book, their writing process, and more, which you can listen to in the latest episode of the SWD podcast.
At more than 400 pages, #MakeoverMonday is a hefty book and contains hundreds (300, to be exact!) of visuals created by more than 50 people. The book was born out of the weekly #MakeoverMonday project that Andy has been doing for a number years (joined by Eva in 2017). Each week, they select a graph and invite people to critique and improve it. People share their creations (see Twitter: #MakeoverMonday). Andy and Eva also host weekly live viz reviews, where they provide feedback to a subset who volunteer their work, with the expectation that the creators each iterate based on that feedback and re-share. More info can be found at makeovermonday.co.uk. Andy and Eva curated examples from this weekly project as the basis for their book.
Given the sheer number and variety of visuals in #MakeoverMonday, it’s great to flip through to see examples of things done well—and some cases of things gone wrong. Many learnings and lessons are recounted, from the habits of a good data analyst to working with incomplete data to trying new things. In particular, I appreciated Chapter 8, “Iterate to Improve,” which focuses on the important role of giving and receiving feedback and illustrates through a number of before and after examples how minor changes can have major impact on the overall effectiveness of a visual. If you analyze and visualize data—or would like to—this is a book you will likely want to have on your shelf.
As a bonus, data from the weekly challenges that feed the visuals profiled in the book are all available for download. This is a great resource if you ever find yourself in need of data to visualize or if you want to recreate or further improve upon any of the examples in the book.
#MakeoverMonday can be purchased on Amazon. Listen to my chat with Andy and Eva in Episode 11 of the SWD podcast.


