learning from the design of everyday objects
Have you ever opened a package and thought, “Why, on earth, is this so frustrating?!”
Recently, I opened a Barbie doll—a birthday gift my daughter gave to a friend who was visiting—and the experience was anything but delightful. Layers of plastic encased in more plastic, secured by an unnecessary number of ties and bands—it felt more like a battle than the unboxing of a toy. Some ties were nearly impossible to cut without damaging the doll—or myself—in the process!
Frustrating designs like this don’t just apply to packaging. Similar challenges can arise with graphs and slides. Just as overly complicated packaging creates unnecessary effort, poorly designed visuals—cluttered graphs, unclear labels, or confusing layouts—force your audience to work harder than they should to understand your message. When your audience is frustrated, they’re less likely to engage with your data or take action.
In the latest episode of the SWD podcast, I explore the lessons we can learn from everyday objects like Barbie and apply them to our data visualizations. From being intentional with design choices to creating experiences that invite rather than repel, there’s a lot we can take from the world around us to improve how we communicate with data.
What everyday design has caught your attention lately? I’d love to hear your thoughts—share in the comments below or join the conversation in our SWD Community.
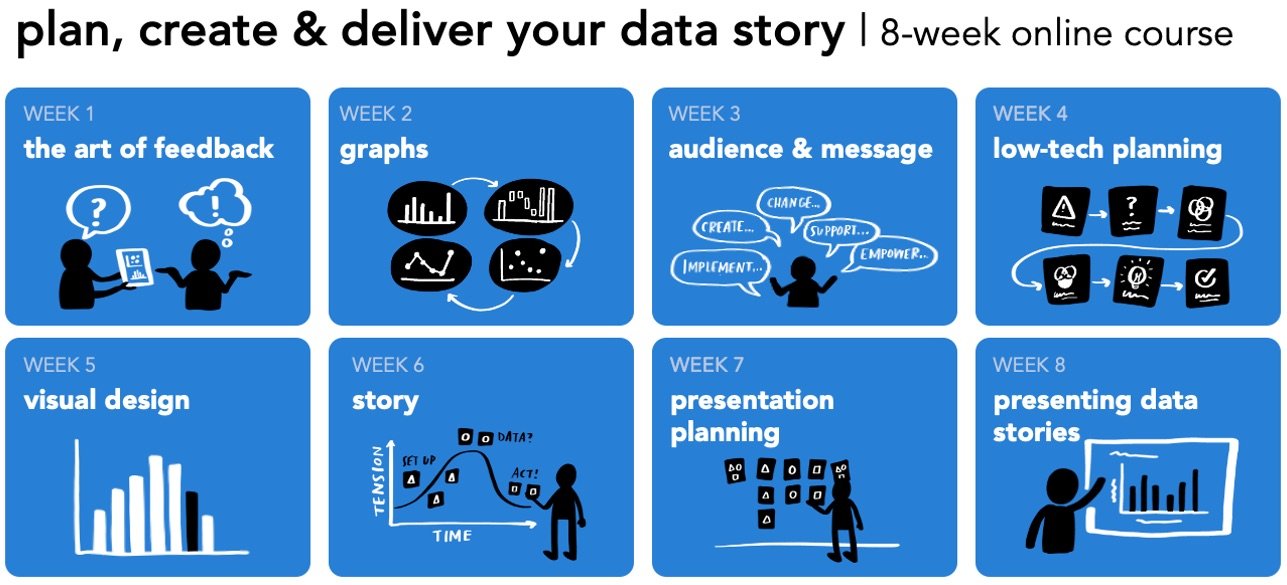
Do you want to learn to create and communicate a powerful data story? Join our upcoming 8-week online course: plan, create, and deliver your data story. Data storytellers Amy and Simon will guide you through the world of storytelling with data, teaching a repeatable process to plan in helpful ways (articulating a clear message and distilling critical content to support it), create effective materials (graphs, slides, and presentations), and communicate it all in a way that gets your audience’s attention, builds your credibility, and drives action. Learn more and register today.

