#SWDchallenge: annotate it!
Words play an important role when communicating with data because they help our graphs make sense to your audience. One place we can incorporate meaningful text is in the form of chart annotations that highlight key data points, explain trends, or add clarity to complex information. When we don’t use annotations, it often requires our audience to do unnecessary work to understand our graphs.
Here’s an example from storytelling with data: a guide for business professionals. Note how the annotation makes the data more accessible in the graph on the right compared to the one on the left.
You can annotate almost any type of chart by adding words next to the data of interest. For example, words next to the 2021 bar in the graph below tell us that major and violent crime has increased by 7.5% since 2020.
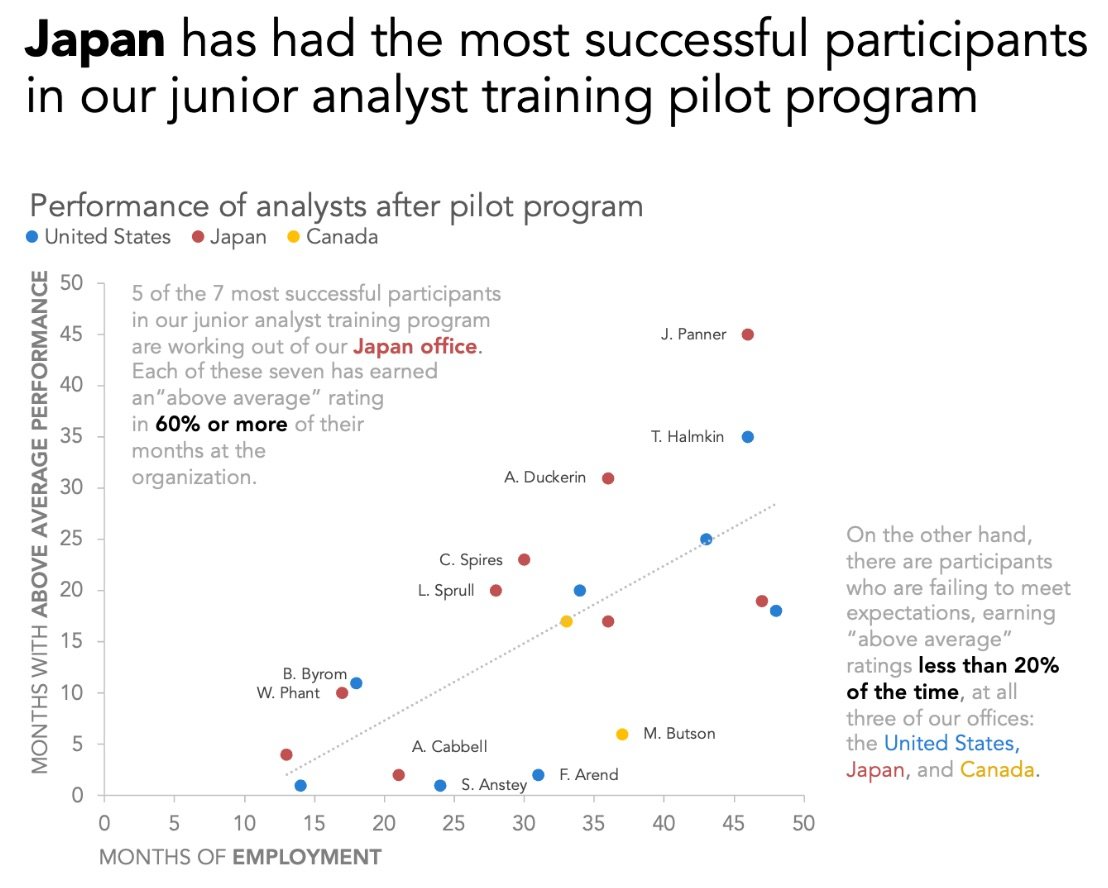
When you have multiple data points you want to highlight, you can apply color to the text callouts to visually link the words and the data, like in the scatterplot below.
This month we challenge you to practice thoughtful application of annotations to a chart of your choosing.
The challenge
Find some data of interest, visualize the information in whatever way you think would be the most effective, and include annotations to highlight noteworthy details.
If you need help finding a data source, check out this list of publicly available data for inspiration. Real-world work examples are also acceptable as long as you anonymize appropriately.
Share your creation in the SWD Community by Tuesday, October 31, 2023 at 5PM PT. If there is any specific feedback or input that you would find helpful, include that detail in your commentary. Take some time to browse others’ submissions, too, and share your input via comments and datapoints over the course of the month.
Related resources
Below are some resources to help you annotate your graph and a few examples for inspiration. If you are aware of other good ones, please share them in your submission commentary.


