#SWDchallenge: create a clever combo chart
When I hear the term combination chart, I think of dual-axis charts with a mix of bars and lines that overlap. Personally, I find these creations cluttered, confusing, and unnecessarily complex.
However, that’s not the only kind of combination chart out there. A more accurate definition of the term might be, “a mashup of two or more graphs with different encodings (length, area, position, intensity, text, etc.) in a single chart.” The charts—or underlying datasets, I should say—often share a common dimension like time or categories, which allows them to be shown in a single view.
With this more exhaustive definition in mind, a combo chart could pair up bars and tables, areas and lines, lines and Gantt charts…the possibilities are endless. The best part is that nowhere in this definition are two vertical axes required!
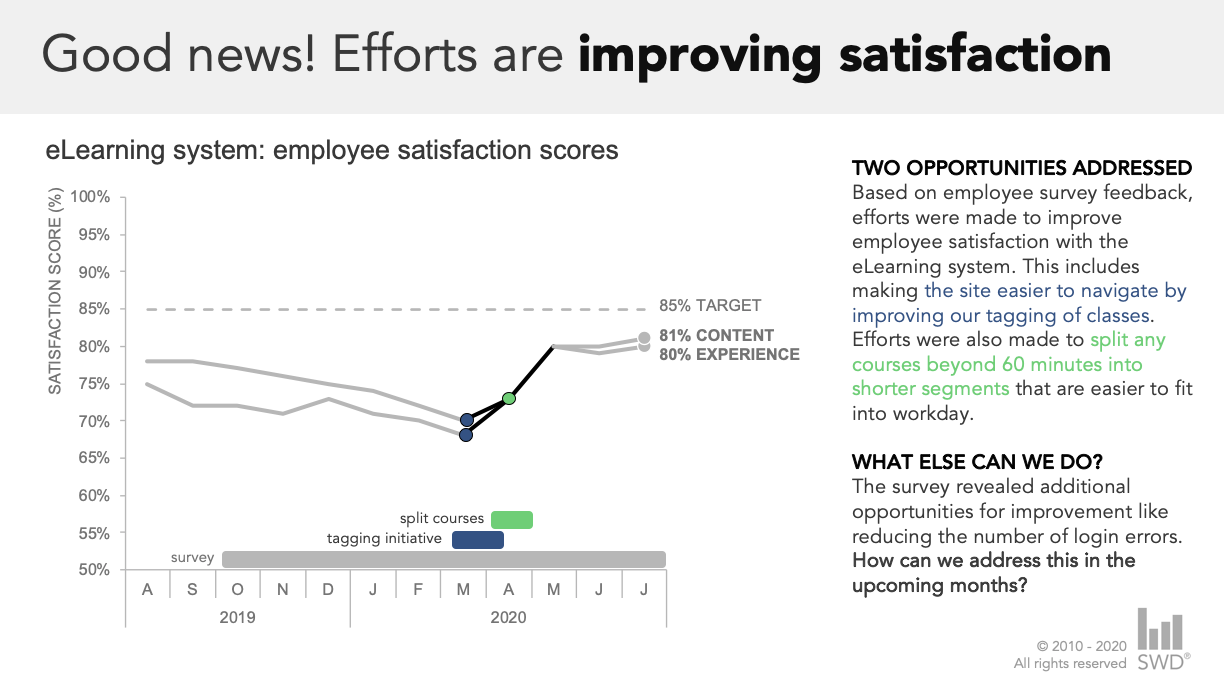
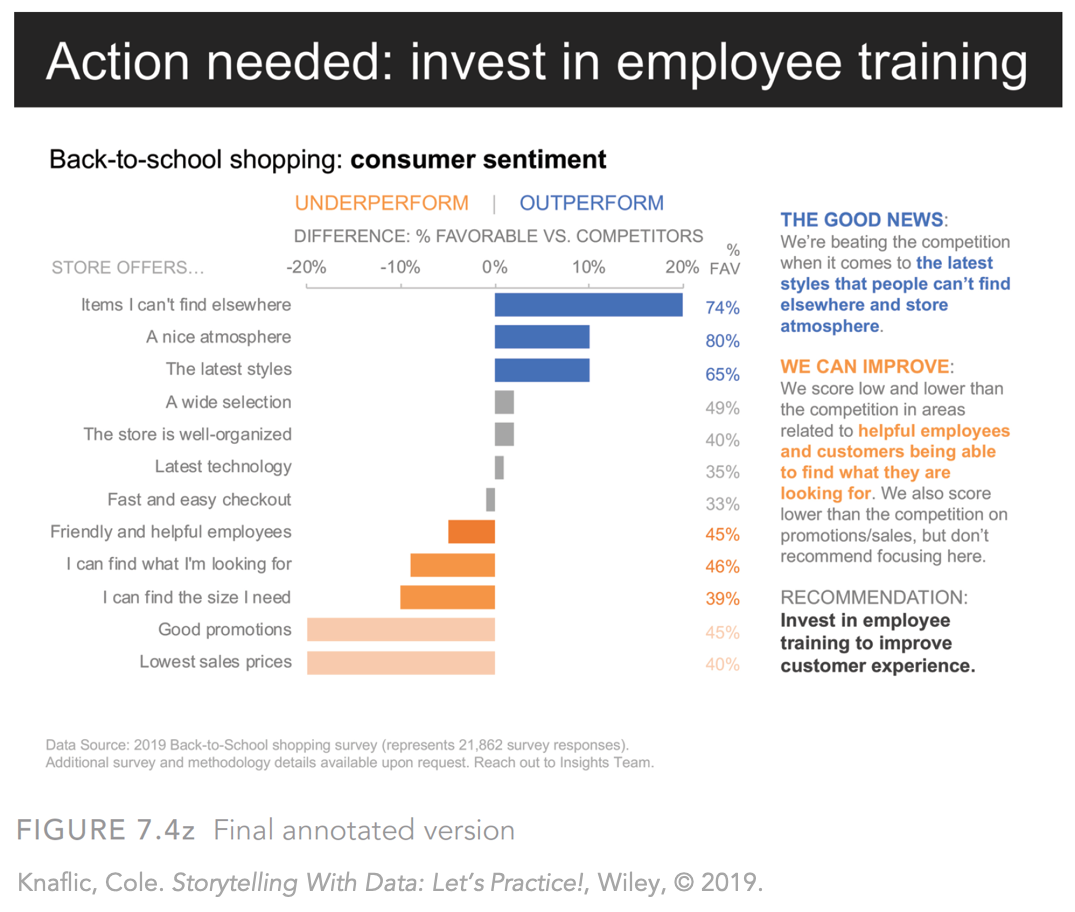
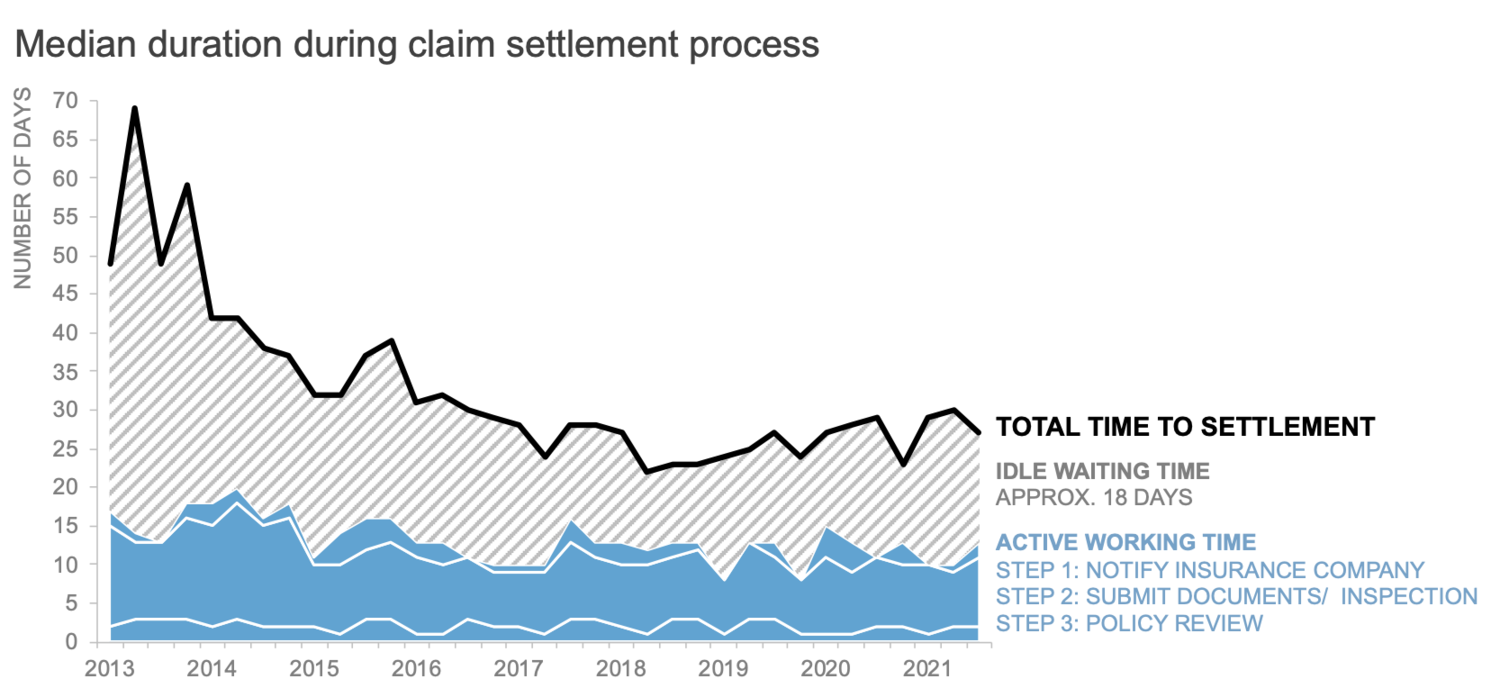
If we use this more inclusive definition of combo charts, then we’d have to say that these kinds of visuals are commonplace at storytelling with data (shown above). When executed well, combo charts can be clever and insightful—providing a more robust understanding than a graph with a single dimension. On the other hand, when not done well, they are subject to all of the negative descriptions mentioned above.
This month, your task is to redefine combo charts by thoughtfully merging two or more charts into one.
The challenge
Find some data of interest that will lend itself well to this task, and cleverly construct your combination chart—any two graphical encodings will work. If you need help getting started, check out this list of publicly available data sources. You’re also welcome to use a real work example if you can anonymize appropriately.
Share your creation in the SWD community by November 30th at 5PM PT. If there is any specific feedback or input that you would find helpful, include that detail in your commentary. Take some time also to browse others’ submissions, and share your input via comments and datapoints over the course of the month.
Related resources
Here are a few related resources. If you are aware of other good ones, please share in your submission commentary.


